I’ve discussed numbers of library school graduates vs. total librarians before, but wanted to give you guys a few more numbers. Keep in mind that these are rough estimates at best: we’re dealing with large numbers, and everyone uses data to serve their organization’s goals, from the American Library Association, Library Journal, the library schools, and the census, to the Bureau of Labor Statistics. I’ve tried to be fair and comprehensive, but I’m sure that even I have a bias. So, please do check and cite the original data, while citing me for any graphs you use.
The Library Journal Placements & Salaries Survey
First off, Stephanie Maatta & the Library Journal run a yearly Placement & Salaries Survey. It’s great, and the reports are useful. I’ve made my graphics below from LJ’s 2014, 2013, 2012, 2011, 2010, 2009 (& here) and 2008 data. Often, they only reported partial data or estimates for grads in that year; the numbers in italics are my calculation given other data for that year:
This suggests that in the last 7 years, almost 40,000 Americans have gained an ALA-accredited MLS, the standard credential for professional librarians. The Library Journal has done well with this survey, but either library schools have been hesitant to systemically collect data or students have been unavailable, because the results are partial. **If you’re a 2014 MLS grad, please respond if your school asks for your data next year… and if no one does, contact LJ or your library school to find out how you can be counted!**
Where do MLS Graduates End Up?
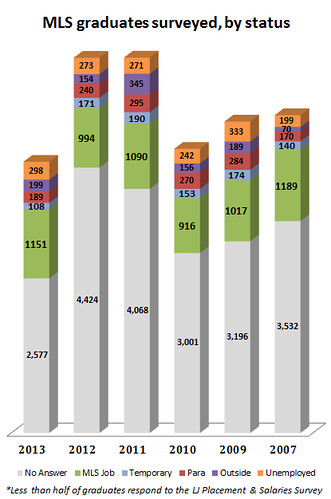
In this next chart, which I’ve also drawn from LJ Placement & Salaries data (2014, 2013, 2012, 2011, 2010, 2009, 2008), we see that half of respondents found a professional job. (Note that LJ groups unemployed and blank responses together). It’s great that half of people reported to LJ found work, but we can’t forget the ‘gray mass’ of graduates who weren’t reported. We can’t assume anything about them, and their absence makes it hard to estimate the proportion of graduates placed:
The Facebook Recent MLS Grads Survey
I’m glad to see that LJ’s proportions of recent grads reporting MLS placement is similar to my small survey of recent MLS grads. We may both have biased response rates, but their systemic survey suggests I’m partly on track:
The U.S. Bureau of Labor Statistics
Stepping back, I’d like to look again at the total number of Librarians (25-4021), which the Occupational Outlook Handbook notes usually have the MLS, in contrast to related but non-professional Library Assistant and Library Technician roles.
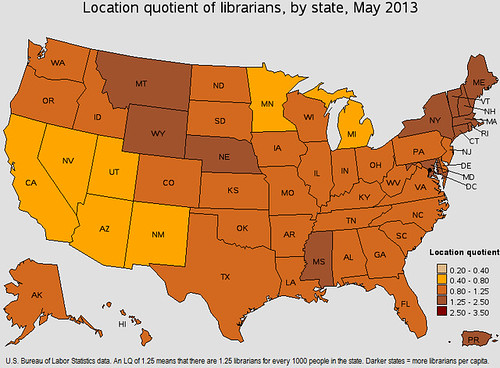
We can see librarians related to total population using the Occupational Employment Statistics (OES) mapping tool below, which shows that there are more librarians per capita in the eastern US:
But how many American librarians are there?
As the ALA reported in 2009, 178,000 people call themselves librarians on the census. That may be like your grandmother calling herself a homemaker– there’s no formal registration process, so this could be someone without a degree, someone retired, someone hoping fora job. The ALA estimates that 105,000 of these have ALA degrees, using the somewhat imprecise logic that they listed some kind of master’s degree plus called themselves a librarian (source).
In my initial scan of the internet, I found 139,000 librarians in 2000, to 147,000 (2005) and then 159,900 (2008). Nice rising numbers, right? But then they dip: the Occupational Outlook Handbook found 156,100 Librarians in 2010, and predicted 10,800 more jobs over the next ten years (7% growth rate). (The ALA notes that these OOH statistics come from the Occupational Employment Statistics, which are collected from a subset of total employers and therefore are projections rather than an actual count).
What happened? Well… in 2012, the OOH found 148,400 professional librarians, a 5% decrease. Oops. Optimistically, they still projected a 7% increase… which would bring us back to earlier levels. The ALA has also been making projections based on the idea that new librarians will replace retirees. However, when I interviewed in Ohio this past summer, I learned of places that are replacing one retiring full timer with two part-timers, so I’m not sure that retirement replacements will give us sustainable jobs!
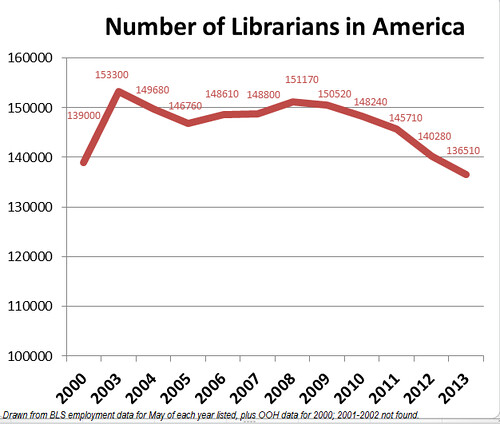
Obviously these estimates will change due to societal changes, as Brett Bonfield notes. As to 2014 levels? The ALA estimates 166,000 librarians, but that includes part-timers in small schools. To visualize change over time, I’ve charted May employment data from the BLS, which I found for 2003, 2004, 2005, 2006, 2007, 2008, 2009, 2010, 2011, 2012, 2013. It’s fuzzy, but it’s the best string of numbers I found:
Result? We do seem to be in somewhat of a slump. Yet, if we can go down 5% in two years, we could also increase in numbers rather quickly. I’d like to see a longer record of employment data for librarians, but even then, I wouldn’t be as confident as the BLS in predicting future numbers.
Do you have more to add here? Corrections for my first attempt at looking at this data? I’d be glad to hear your thoughts!


